 eAtlas Data Catalogue
ARC Centre of Excellence for Coral Reef Studies, James Cook University
Type of resources
Topics
Keywords
Contact for the resource
Provided by
Representation types
status
-
The database contains native and alien species records for National Park islands in the southern Great Barrier Reef. Attributes for each record include information on abundance, life history traits, habitat requirements, limitations of source, and relevant species information from government bodies including EPBC and NCA listings. Basic interaction information among species (alien vs. native) is also recorded. This dataset also has basic information about the islands such as area, location, and regional ecosystem types present on the island. One shapefile, Island Threats, contains information on the presence and absence of a number of animals and plant threats on islands in the Southern Great Barrier Reef as elicited from experts. Each spatially explicit point represents data for a given species on a specific island. Another shapefile, Regional Ecosystems, contains information on the various Queensland Herbarium regional ecosystem (RE) types extracted for National Park Islands in the Southern Great Barrier Reef. Individual polygons represent an area of a specific RE type. The last shapefile, Features on Islands, contains information on the abundance of a number of native animals on islands in the Southern Great Barrier Reef as elicited from experts. Each spatially explicit point represents data for a given species on a specific island. This database was created as a basis for the decision support tool being developed for NERP 9.3. The database is the most complete dataset for the islands in the Southern Great Barrier Reef at the time of release. Method: Database: A comprehensive literature review was conducted for all published and ‘grey’ source material containing biological records for National Park islands in the southern Great Barrier Reef (GBR). Unpublished species records were also compiled from sources such as WildNet, the Queensland Herbarium, and personal communications. For a given source, each species on each island received a unique record. Records were structured within the database so that each record remained associated with its source, allowing revisitation in order to review records within their original context. Attributes relevant to each record were extracted from source, including information on habitat requirements, life history traits, abundance, and source limitations e.g. incomplete sampling of island area. Additional attributes for each record were extracted from the Australian and Queensland government websites, including information on EBPC and CNA listings, and endemicity. Island Threats: Experts who frequent the islands were consulted as to whether they believed a given threat was present or absent on the islands. These data were input into the associated access database Island_database.accbd, and then transformed into the point based shapefile. The following is the list of threats considered in this dataset. * African Big Headed Ant * Black Rat * Brushtail Possum * Cane toad * Climbing Asparagus * Cobblers Peg * Red Junglefowl * Dwarf Poinsettia * Eastern Grey Kangaroo * Feral Cat * Feral Cattle * Feral Goat * Feral Horse * Feral Pig * Fox * Green Panic * Groundsel * Guinea Grass * Hog Deer * House Mouse * House Sparrow * Lantana * Morning Glory * Mother of Millions * Nightshade * Noogoora Burr * Periwinkle * Rubbervine * Singapore Daisy * Sisal Hemp * Soft Scale * Yellow Guava * Molasses Grass * Mossman River Grass * Mother-in-Law Tongue * Pink Periwinkle * Prickly Pear Regional Ecosystems: Shape files of regional ecosystem (RE) types and National Park Islands in the Southern GBR were obtained from Queensland Herbarium (in 2014). These data were rearranged and merged to create a single shape file. eAtlas editor note: It was noticed when mapping this shapefile that many of the polygon regions had multiple overlapping features, sometimes consisting of duplicates, and sometimes containing multiple RE codes. The cause of this in the dataset is unknown. A map of these overlaps was made by rendering them as black transparent polygons. This map is available in the download section of this metadata record. Features on Islands: Experts who frequent the islands were consulted as to the maximum and minimum number of individuals/pairs of native species on the islands. On each island there are multiple estimates for each species, one from each expert. The following is the set of species that are included in this dataset. * Anous minutus (Black noddy) * Anous stolidus (Brown noddy) * Burhinus grallarius (Bush stone-curlew) * Calyptorhynchus lathami (Glossy black cockatoo) * Caretta caretta (Loggerhead sea turtle) * Charadrius ruficapillus (Red-capped plover) * Chelonia mydas (Green sea turtle) * Chroicocephalus novaehollandiae (Silver gull) * Egretta sacra (Pacific reef heron) * Epthianura crocea (Yellow chat) * Esacus magnirostris (Beach stone-curlew) * Falco peregrinus (Peregrine falcon) * Fregata ariel (Lesser frigatebird) * Fregata minor (Great frigatebird) * Gallirallus philippensis (Buff-banded rail) * Haematopus fuliginosus (Sooty oystercatcher) * Haematopus longirostris (Pied oystercatcher) * Haliaeetus leucogaster (White-bellied sea eagle) * Haliastur indus (Brahminy kite) * Hydroprogne caspia (Caspian tern) * Megapodius reinwardt (Orange-footed scrubfowl) * Natator depressus (Flatback sea turtle) * Onychoprion anaethetus (Bridled tern) * Onychoprion fuscata (Sooty tern) * Pandion cristatus (Osprey) * Phaethon rubricauda (Red-tailed tropicbird) * Phalacrocorax varius (Australian pied cormorant) * Phascolarctos cinereus (Koala) * Pluvialis squatarola (Grey plover) * Ptilinopus regina (Rose-crowned fruit dove) * Sterna dougallii (Roseate tern) * Sterna sumatrana (Black-naped tern) * Sternula albifrons (Little tern) * Sula dactylatra (Masked booby) * Sula leucogaster (Brown booby) * Thalasseus bengalensis (Lesser crested tern) * Thalasseus bergii (Greater crested tern) * Tringa brevipes (Grey-tailed tattler) * Xeromys myoides (False Water Rat) * Zosterops lateralis (Silvereye) Further information on the methodology can be found in the final report for this project: Pressey, R., Wenger, A. (2015) Prioritising Management Actions for Great Barrier Reef Islands. http://www.nerptropical.edu.au/sites/default/files/publications/files/NERP9.3_final_report-FINAL-Complete.pdf Limitations of the data: Database: Abundance data varies over different units of time. For example in the ‘Total’ column, 100 might indicate 100 individuals observed in a single survey, or over repeated visits to an island. The units of observation are maintained in the ‘Abundance’ column, e.g. 100/birds January 2000. Values in the ‘Total’ column should be interpreted in conjunction with the ‘Abundance’ column. We have removed any data for which we have data sharing agreements. Therefore, the database used for this project is much more comprehensive than we are able to submit. Island Threats: The shapefile is limited to presence or absences only for a focal number of threats on targeted islands in the Southern Great Barrier Reef. There is no data on the number of individuals or the extent of the species on the islands. The presence or absence of a species is based on general consensus by experts. If there is no point for a given island/threat pair then the presence of absence of the species on that island is unknown. Regional Ecosystems: The shapefile is limited to National Park Islands in the Southern Great Barrier Reef. Information on RE types on other islands exists but was not the focus of this work. In some cases multiple polygons of the same shape and size exist for the same region of an island. Here a number of RE types were recorded within the polygon/area but the exact spatial extent of the RE is unknown, only the percentage of the polygon/area that the RE covers. Features on Islands: The shapefile is limited to best guess estimates of the maximum and minimum number of individuals/pairs of a select number of native species on an island. The extent of the species on the island and how the population has changed over time are not known. Format: Island_database.accbd Format: Access database. This database contains a number of tables which are categorised according to their name: 1 "Records:…" are record tables where each row is a specific record relating to the focus of the table. 2 "Attributes:…" are attribute tables which have information specific to each category (e.g. islands, native animals, regional ecosystems. Attribute tables typically list the primary keys for each category which link to the records tables. 3 "Stats:…" are tables that contain basic statistics on records tables. These have been created using queries and will have queries with associated query names. 4 "Queries:…" are tables that have been created from queries (other than specific statistics queries) run on records/attributes tables and will have queries with associated query names. This database also contains a number of queries which are based on the records/attributes tables, a most of which are linked to stats or queries tables of an associated name. See the ‘Design View’ of any of the tables for more information, in particular for column/field descriptions. Island Threats: Threats_on_Islands.*, GIS shape file Projected Coordinate System: GDA_1994_MGA_Zone_55 Projection: Transverse_Mercator Data dictionary: - Isl_name: name of the island where the record occurs - LONG: x co-ordinate location of the island (descimal degrees) - LAT: y co-ordinate location of the island (descimal degrees) - Threat: Common name of the threat - Interactio: Whether the threat species is present (1) or absent (0) on the island Regional Ecosystems: RE_on_NP_Islands.*, GIS shape file Projected Coordinate System: GDA_1994_MGA_Zone_55 Projection: Transverse_Mercator Data dictionary: - RE_type: Code for the regional ecosystem type, see associated access database Island_database.accbd for RE type descriptions - PC_of_Poly: percentage of the polygon that the RE covers. When <100% there are multiple polygons for the specific location, each with different RE types - X_COORD: x co-ordinate of the centroid of the polygon (decimal degrees) - Y_COORD: y co-ordinate of the centroid of the polygon (decimal degrees) - IslAreaHA: Area (hectares) of the island on which the RE polygon occurs - Is_X_Coord: x co-ordinate of the centroid of the island (decimal degrees) - Is_Y_Coord: y co-ordinate of the centroid of the island (decimal degrees) - Islandname: Name of the island where the RE occurs - REAreaHA: Size of the polygon (hectares) Features on Islands: Features_on_Islands_EE.*, GIS shape file Projected Coordinate System: GDA_1994_MGA_Zone_55 Projection: Transverse_Mercator Data dictionary: - Isl_name: name of the island where the record occurs - LONGITUTDE: x co-ordinate location of the island (descimal degrees) - LATITUTDE: y co-ordinate location of the island (descimal degrees) - Species_na: accepted scientific name of the native (feature) species - Upper_boun: Maximum population size as estimated by experts - Lower_boun: Minimum population size as estimated by experts Note: for birds population estimates are of the number of breeding pairs, for all other species estimates are of the number of individuals on the island.
-
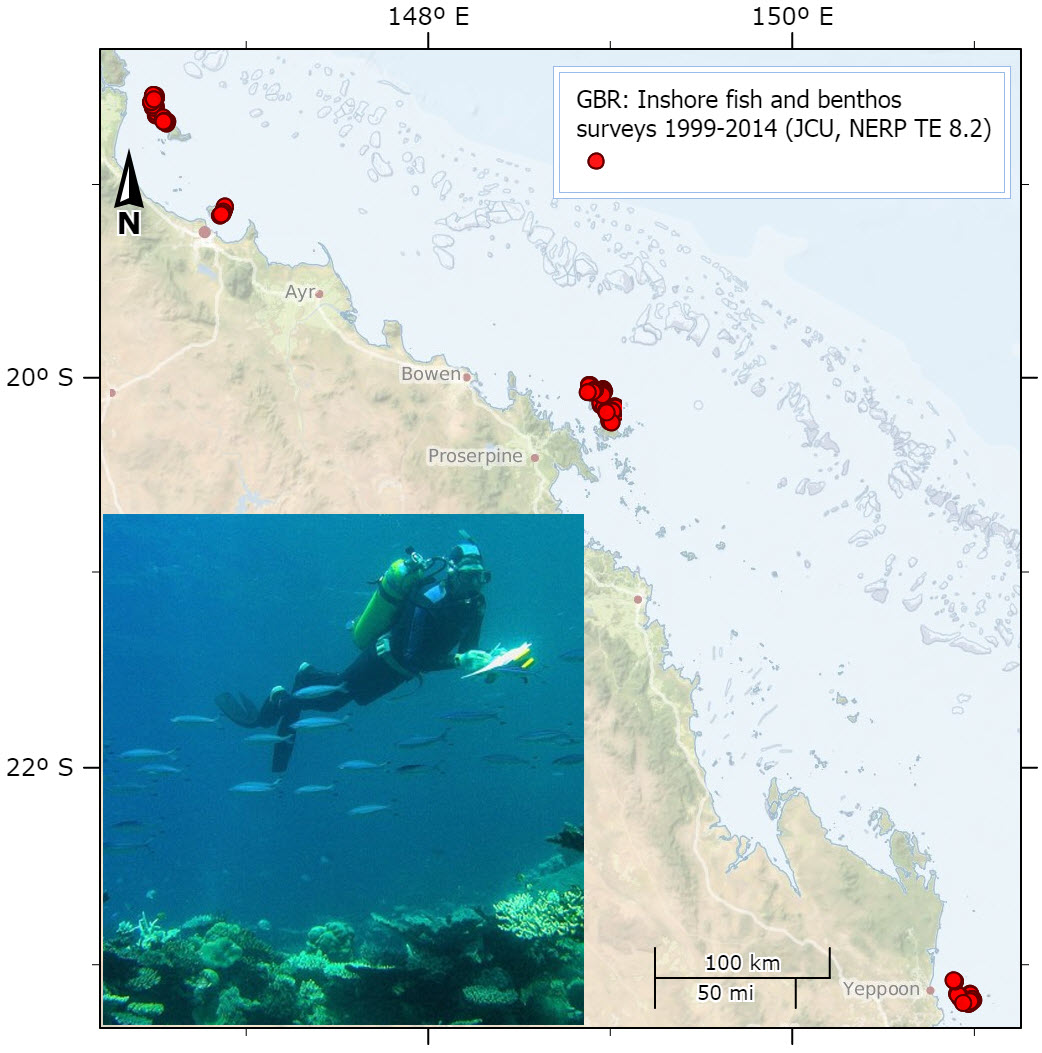
This dataset consists of site and zone means of the percent cover of major benthic categories and the density of fish functional groups on fringing coral reefs of the Keppel, Whitsunday and Palm Island groups, as a result of monitoring surveys carried out between 1999 and 2014. This data extract summarises the results of a long-term monitoring project that assesses the effects of no-take marine reserve zoning in the Great Barrier Reef Marine Park. Spatial zoning for multiple-use is the cornerstone of management for the Great Barrier Reef Marine Park (GBRMP). Multiple-use zoning was first implemented widely in the GBRMP in the late 1980’s and this original zoning plan was in place until 2004, when the marine park was completely rezoned under the Representative Areas Program (RAP). The overall proportion of the marine park area assigned into NTRs was increased from around 5% (~ 25% of the coral reefs) to 33.4%. The need to objectively assess the ecological consequences of zoning management has attracted an increasing amount of research effort in recent years. Critical knowledge gaps still remain however, and research is required to determine how and to what extent NTR networks may help to protect biodiversity, sustain stocks of fished species and increase ecosystem resilience. This project was established in 1999 and expanded in 2004, with the primary objective of providing a robust assessment of the ecological effects of multiple-use zoning on inshore coral reefs of the GBRMP. The project uses underwater visual census (UVC) to provide a spatially and temporally replicated assessment of fish and benthic communities and will include concurrent surveys of coral health within no-take (Green) and fished (Blue) zones on high-use inshore reefs. It is one of the few long-term monitoring projects specifically assessing the effects of zoning management within the GBRMP and the only one with a solid baseline data set that was established prior to the implementation of the 2004 zoning management plan. Methods: Underwater visual census (UVC) was used to survey reef fish and benthic communities on fringing coral reefs of the Palm, Magnetic, Whitsunday and Keppel Island groups. Within each island group, sites are evenly distributed between zones that have remained open to fishing (General Use and Conservation Park zones), NTRs that were closed to fishing in 1987, and NTRs that were established in 2004 (Marine National Park zones). Within each site UVC surveys were conducted using 5 replicate transects (50m x 6m, 300m2 survey area). Transects were deployed on the reef slope between approximately 4 and 12 metres depth. Using SCUBA, two observers recorded approximately 190 species of fish from 15 Families (Acanthuridae, Balistidae, Chaetodontidae, Haemulidae, Labridae, Lethrinidae, Lutjanidae, Mullidae, Nemipteridae, Pomacanthidae, Pomacentridae, Scaridae, Serranidae, Siganidae and Zanclidae). A third diver (observer 3) swam directly behind observers one and two, deploying the transect tapes. This UVC technique reduces diver avoidance or attraction behaviour of the surveyed fish species. To increase accuracy of the fish counts, the species list was divided between the two fish observers. Observer one surveyed the fish families Haemulidae, Lethrinidae, Lutjanidae, Mullidae, Nemipteridae, Serranidae and the larger species of Labridae targeted by fishers. Observer two surveyed the families Acanthuridae, Balistidae, Chaetodontidae, Pomacanthidae, Pomacentridae, Scaridae, Siganidae, Zanclidae and small ‘non-targeted’ species of Labridae. Pomacentrids and small labrids were recorded by observer two during return transect swims within a 2m band (1m either side of the tape, 100m2 survey area). Broad-scale structural complexity of the reef habitat was estimated by observer one using a simple method that applied a rank (1-5) to both the angle of the reef slope and the rugosity for each ten-metre section of each transect. Observer three utilised a line intercept survey method to record a benthic point sample every metre along each transect tape (50 samples per transect).Benthos sampled in the benthic survey was live and dead hard coral within morphological categories (branching, plate, solitary, tabular, massive, foliose, encrusting) live soft coral, sponges, clams (Tridacna spp.), other invertebrates (such as ascidians and anemones), macro-algae, coral reef pavement, rock, rubble and sand. Limitations: Not all island groups could be surveyed in each year, usually due to funding limitations and unpredictable weather events. Format: The data are contained within two worksheets of an Excel file (215 kB). All benthic data is in % cover, and fish data are in density (individuals per 1000 m2). The first worksheet shows the data averaged for each site, and the second worksheet has average values for each zone (Fished, NTR 1987 and NTR 2004). Data Dictionary: Names in rounded brackets () are the matching names in the shapefile. This was done to meet the 10 character limitation of this format. - SE - Standard Error - mean - Mean over the transects at a site. - Total Fish Densit_mean (TFishDenMn) - Total Fish Densit_SE (TFishDenSE) - Fish Species richness_mean (FishRichMn) - Fish Species richness_SE (FishRichSE) - Fishery Target Spp_mean (FishTargMn) - Pooled group of fish species designated as 'Primary target’ in the species list file. - Fishery Target Spp_SE (FishTargSE) - Grazers_mean (GrazersMn) - Pooled group of fish species listed as ‘grazers’ in the species list - Grazers_SE (GrazersSE) - Corallivores_mean (CorallivMn) - Coraliivores_SE (CorallivSE) - Planktivores_mean (PlanktivMn) - Planktivores_SE (PlanktivSE) - Territorial Pomacentrids_mean (TerrPomaMn) - Territorial Pomacentrids_SE (TerrPomaSE) - Plectropomus spp_mean (PlectSppMn) - Plectropomus spp_SE (PlectSppSE) - SCI_mean - Structural complexity Index.. An index (1-25) calculated by multiplying our visual estimates of reef slope angle (1-5) by reef slope rugosity (Complexity 1-5). These values are estimated for each 10m section of each 50m transect. 5 transects per site = 25 SCI estimates per site. The e-atlas data we have provided is site means… i.e.. the mean of those 25 values. - LCC - Live coral cover (percent cover), live hard and soft coral pooled. - LHC - Live hard coral cover (%), live hard coral only. - MAC - Macro Algae Cover % (fleshy algas only, does not include turf algae) - Fish Line_SUM - is the pooled number of lines recorded on the 5 transects surveyed at each site. = total number of lines/1500m2. - Line Accumulation Rate - number of lines accumulated per month. References: 1. Williamson D.H., Ceccarelli D.M., Evans, R.D., Jones, G.P., Russ, G.R. (2014). Habitat dynamics, marine reserve status, and the decline and recovery of coral reef fish communities. Ecology & Evolution 4: 337-354. 2. Hassell N.S., Williamson D.H., Evans R.D., Russ G.R. (2013). Reliability of non-expert observer estimates of the magnitude of marine reserve effects. Coastal Management 41(4): 361-380. 3. Wen C.K., Almany G.R., Williamson D.H., Pratchett M.S., Mannering T.D., Evans R.D., Leis J.M., Srinivasan M., Jones G.P. (2013). Recruitment hotspots boost the effectiveness of no-take marine reserves. Biological Conservation 166: 124-131. 4. Wen C.K., Almany G.R., Williamson D.H., Pratchett M.S., Jones G.P. (2012). Evaluating the effects of marine reserves on diet, prey availability and prey selection by juvenile predatory fishes. Marine Ecology Progress Series 469: 133-144. 5. Harrison H.B., Williamson D.H., Evans R.D., Almany G.R., Thorrold S.R., Russ G.R., Feldheim K.A., van Herwerden L., Planes S., Srinivasan M., Berumen M.L., Jones G.P. (2012). Larval Export From Marine Reserves and the Recruitment Benefit for Fish and Fisheries. Current Biology 22: 1023-1028. 6. Ceccarelli D.M., Williamson D.H. (2012). Sharks that eat sharks: Opportunistic predation by wobbegongs. Coral Reefs 31: 471. 7. McCook L.J., Ayling A.M., Cappo M., Choat J.H., Evans R.D., De Freitas D.M., Heupel M., Hughes T.P., Jones G.P., Mapstone B., Marsh H., Mills M., Molloy F., Pitcher C.R., Pressey R.L., Russ G.R., Sutton S., Sweatman H., Tobin R., Wachenfeld D.R., Williamson D.H. (2010). Adaptive management of the Great Barrier Reef: A globally significant demonstration of the benefits of networks of marine reserves. Proceedings of the National Academy of Science (PNAS) 107: 18278-18285. 8. Diaz-Pulido G., McCook L.J., Dove S., Berkelmans R., Roff G., Kline D.I., Weeks S., Evans R., Williamson D.H., Hoegh-Guldberg O. (2009). Doom and Boom on a Resilient Reef: Climate Change, Algal Overgrowth and Coral Recovery. PLoS ONE 4: e5239. 9. Chin A., Sweatman H., Forbes S., Perks H., Walker R., Jones G.P., Williamson D.H., Evans R.D., Hartley F., Armstrong S., Malcolm H., Edgar G.J. (2008). Status of coral reefs in Australia and Papua New Guinea. In: Status of the coral reefs of the world: 2008 (ed. Wilkinson, C.), Global Coral Reef Monitoring Network and Reef and Rainforest Research Centre, Townsville, 296pp. 10. Russ G.R., Cheal A.J., Dolman A.M., Emslie M.J., Evans R.D., Miller I., Sweatman H., Williamson D.H. (2008). Rapid increase in fish numbers follows creation of world's largest marine reserve network. Current Biology 18: 514-515. 11. Williamson D.H., Evans R.D., Russ G.R. (2006). Monitoring the ecological effects of management zoning: Initial surveys of reef fish and benthic communities on reefs in the Townsville and Cairns regions of the Great Barrier Reef Marine Park. Report to the Great Barrier Reef Marine Park Authority (GBRMPA) 67pp. 12. Williamson D.H., Russ G.R., Ayling A.M. (2004). No-take marine reserves increase abundance and biomass of reef fish on inshore fringing reefs of the Great Barrier Reef. Environmental Conservation 31: 149-159. 13. Davis K.L.F., Russ G.R., Williamson D.H., Evans R.D. (2004). Surveillance and poaching on inshore reefs of the Great Barrier Reef Marine Park. Coastal Management 32: 373-387.
-
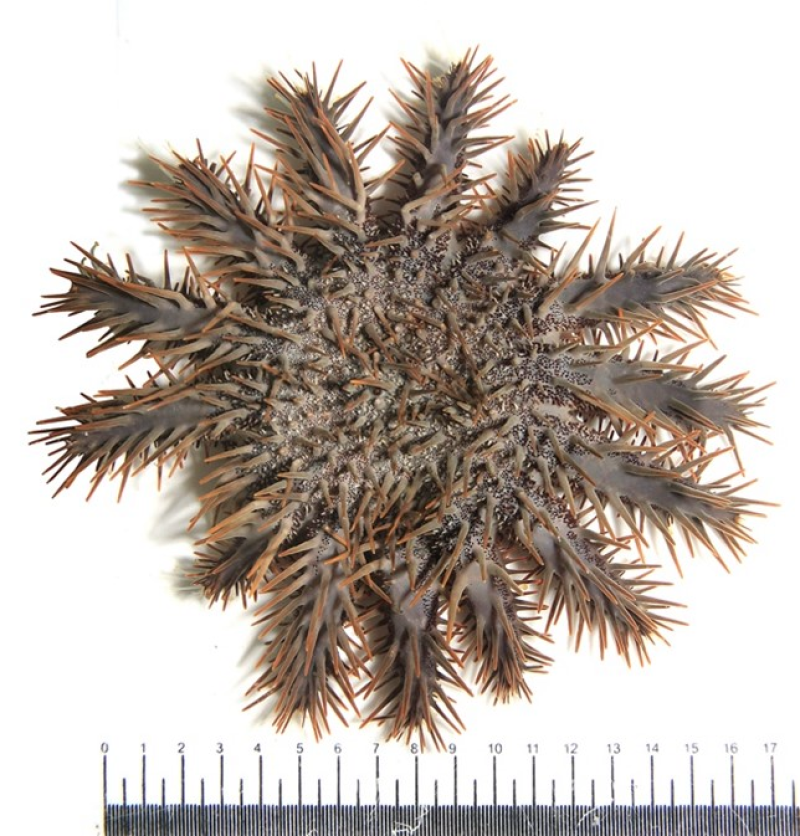
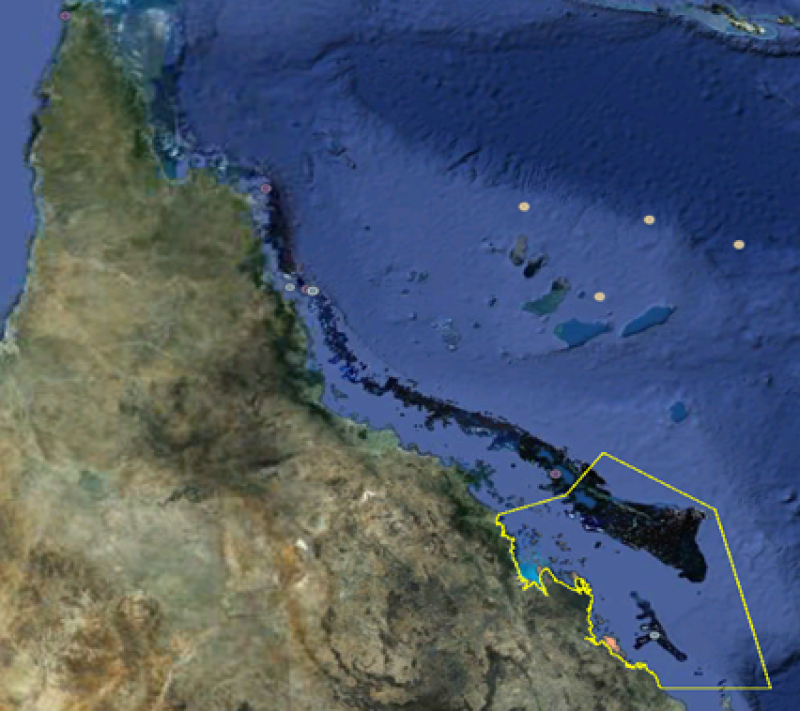
This dataset collected variation in the demography of Pacific crown-of-thorns starfish (Acanthaster cf. solaris) during the latest period of elevated starfish densities (active population irruptions) in the central section of Australia’s Great Barrier Reef. Specifically, we examined variation in i) the prevalence and severity of sub-lethal injuries among juvenile and adult crown-of-thorns starfish, and ii) the recruitment, growth and survivorship of early-stage juvenile starfish, across different management zones where fishing is restricted (Habitat Protection Zone, Conservation Park Zone) versus effectively prohibited (Marine National Park Zone). Methods: Prevalence of severity of injuries in adult crown-of-thorns starfish A total of 5,238 Pacific crown-of-thorns starfish (Acanthaster cf. solaris) were sampled across 80 reefs in the Great Barrier Reef Marine Park, building substantially on the sample (n = 3,846) of starfish analysed previously (Messmer et al. 2017). All starfish were carefully extracted from the reef matrix, using purpose-built large stainless-steel tongs or hooks, taking care not to damage the starfish. Starfish were then kept in mesh bags or perforated collection boxes for transport to support vessels. All starfish were processed within 3 hours of collection, except where we had access to holding facilities with large tanks and rapid exchange of fresh seawater (e.g., at Lizard Island Research Station) and could maintain the starfish for prolonged periods with limited adverse effects on individual condition. Determining evidence of injuries (Rivera-Posada et al. 2014) The total diameter of individual starfish was measured by inverting starfish on a flat surface and measuring the distance between tips of opposite and undamaged arms. Measurements were taken (to the nearest mm) from the termination of the ambulacral grooves and ignoring the spines projecting from the tips of the arms. Where starfish were noticeably asymmetrical, the diameter was measured at least twice and then averaged. The underside (oral surface) of starfish was then examined to determine the number of arms, and evidence of injuries. The total number of arms was counted based on the number of discrete ambulacral grooves extending directly from the oral cavity. Arms were considered to be damaged if they were less than 75% the length of the other seemingly intact arms, or were conspicuously damaged, missing or regenerating. Recent injuries (e.g., fresh tears in the surface integument) were disregarded, as they likely occurred during collection. The incidence of injuries was determined based on the proportion of starfish with any evidence of injuries, whereas severity of injuries was estimated based on the proportion of an individual’s arms that were injured. Where only the number of injured arms was recorded, this was expressed as a proportion, using the median number of arms (15) recorded for all A. cf. solaris where the number of arms was counted. Further information can be found in this publication: Rivera-Posada J, Caballes CF, Pratchett MS (2014) Size-related variation in arm damage frequency in the crown-of-thorns sea star, Acanthaster planci. Journal of Coastal Life Medicine 2:187-195 Variation in the incidence (proportion of individuals with injuries) and severity (proportion of arms damaged or missing on injured starfish) was compared among reefs within each of three different management zones; i) Marine National Park Zones (GREEN; “No-take”); ii) Conservation Park Zones (YELLOW; “Limited take”); and iii) Habitat Protection Zones (BLUE; “Take”) as well as across sizes of COTS. Prevalence of severity of injuries in juvenile crown-of-thorns starfish (Wilmes et al. 2016, 2019, 2020) Variation in the incidence and severity of injuries was also assessed for 200 early-stage juvenile A. cf. solaris (size range = 5–45 mm diameter) – presumed to be <1 year old. These early-stage juveniles were sampled from an extensive collection of early-stage juvenile starfish (n = 3,532) that had been collected on the GBR in 2015 (Wilmes and Schultz 2019). Sampling was in the present study intentionally biased towards the largest, and presumably oldest, individuals to avoid confusion between newly-forming versus regenerating arms. All starfish were collected on SCUBA (max depth = 15 m), during extensive searching in areas of unconsolidated coral rubble, interspersed with patches of consolidated carbonate and live corals. Starfish were preserved in 95% ethanol following collection for later processing. Further information can be found in these publications: Wilmes J, Matthews S, Schultz D, Messmer V, Hoey A, Pratchett M (2016) Modelling growth of juvenile crown-of-thorns starfish on the northern Great Barrier Reef. Diversity. 9, 1; Wilmes JC, Hoey AS, Mesmer V, Pratchett MS (2019) Incidence and severity of injuries among juvenile crown-of-thorns starfish on Australia's Great Barrier Reef. Coral Reefs 38:1187-1195; Wilmes JC, Schulz DJ (2019) Size and diet of newly settled crown-of-thorns starfish from Australia's Great Barrier Reef. James Cook University (dataset); Wilmes JC, Schultz DS, Hoey AS, Messmer V, Pratchett MS (2020b) Habitat associations of settlement-stage crown-of-thorns starfish on Australia’s Great Barrier Reef. Coral Reefs 39, 1163-1174 The aboral side of each of the 200 juvenile starfish selected for this study was photographed using an Olympus Om-D E-M5 camera. For each starfish, the number of arms was counted and its maximum radius was measured from the centre of the aboral disc area to the tip of the longest arm (using ImageJ1). Injured arms were defined as those that were >10% shorter than the radial extent of the longest arm, following Bos et al (2011). Further information can be found in this publication: Bos AR, Gumanao GS, Van Katwijk MM, Mueller B, Saceda MM, Tejada RL (2011) Ontogenetic habitat shift, population growth, and burrowing behavior of the Indo-Pacific beach star, Archaster typicus (Echinodermata; Asteroidea). Marine Biology 158:639-648 Recruitment and survival of juvenile crown-of-thorns starfish Field studies were conducted in 2018 and 2019 at five mid-shelf reefs (Kelso Reef, Little Kelso reef, Rib Reef, Lodestone Reef and Keeper Reef) of the central GBR to explore variation in recruitment and survival of early-stage juvenile crown-of-thorns starfish between reefs where fishing was permitted (Habitat Protection Zone; n = 3) versus those where fishing was not allowed (Marine National Park Zone; n = 2). Each reef was surveyed twice each year (June and November). Reefs were selected to represent contrasting GBRMPA management zones, at the time of active CoTS outbreaks. The specific study locations at each reef were chosen following extensive surveys at selected locations, which identified areas with elevated densities of early-stage juvenile CoTS. The initial surveys in June 2018 were conducted at least 5 months after peak annual spawning and settlement (in late December and early January, respectively; Uthicke et al. 2019) as newly settled starfish are difficult to be visually detected prior to this time. Survey methodology for juvenile crown-of-thorns starfish (Wilmes et al. 2020) While study locations varied in their orientation to the prevailing south-east trade winds, they were all characterised by relatively steep slopes, enabling sampling of multiple depths (up to 15 m water depth). Surveys were conducted following an adapted version of Wilmes et al. (2020), using 60 replicate 1m × 1m quadrats to survey each location. Replicate quadrats were placed haphazardly, working systematically from the bottom of the reef slope up to the reef crest and avoiding areas comprised mostly or entirely of sand. To maximize detection of early-stage juvenile starfish, the area encompassed within each quadrat was further divided into quadrants, which were thoroughly searched in turn. All starfish detected (up to 200m diameter) were measured in situ. Further information can be found in this publication: Wilmes JC, Hoey AS, Pratchett MS (2020) Contrasting size and fate of crown-of-thorns starfish linked to ontogenetic diet shifts. Proc R Soc B 287: 20201052 Format: Dataset is saved .csv (COTS_Sublethal_Injury_Data.csv) Data Dictionary: - SAMPLE = Sample Label - REGION = GBR Section - REEF = Reef Name - ZONE = Management Zone - Blue Zone = Habitat Protection Zone (“Take”) - Yellow Zone = Conservation Park Zone (“Limited Take”) - Green Zone = Marine National Park Zone (“No-Take”) - MaxD = Maximum Diameter - Injured.Arms = Number of Injured Arms - Total.Arms = Total Number of Arms - Severity = Number of Injured Arms / Total Number of Arms - PA = Presence/Absence of Injuries (Prevalence) References: Bos AR, Gumanao GS, Van Katwijk MM, Mueller B, Saceda MM, Tejada RL (2011) Ontogenetic habitat shift, population growth, and burrowing behavior of the Indo-Pacific beach star, Archaster typicus (Echinodermata; Asteroidea). Marine Biology 158:639-648 Rivera-Posada J, Caballes CF, Pratchett MS (2014) Size-related variation in arm damage frequency in the crown-of-thorns sea star, Acanthaster planci. Journal of Coastal Life Medicine 2:187-195 Wilmes J, Matthews S, Schultz D, Messmer V, Hoey A, Pratchett M (2016) Modelling growth of juvenile crown-of-thorns starfish on the northern Great Barrier Reef. Diversity. 9, 1 Wilmes JC, Hoey AS, Mesmer V, Pratchett MS (2019) Incidence and severity of injuries among juvenile crown-of-thorns starfish on Australia's Great Barrier Reef. Coral Reefs 38:1187-1195 Wilmes JC, Hoey AS, Pratchett MS (2020) Contrasting size and fate of crown-of-thorns starfish linked to ontogenetic diet shifts. Proc R Soc B 287: 20201052 Wilmes JC, Schultz DS, Hoey AS, Messmer V, Pratchett MS (2020b) Habitat associations of settlement-stage crown-of-thorns starfish on Australia’s Great Barrier Reef. Coral Reefs 39, 1163-1174 Data Location: This dataset is filed in the eAtlas enduring data repository at: data\custodian\2018-2021-NESP-TWQ-4\4.1_COTS-surveillance
-
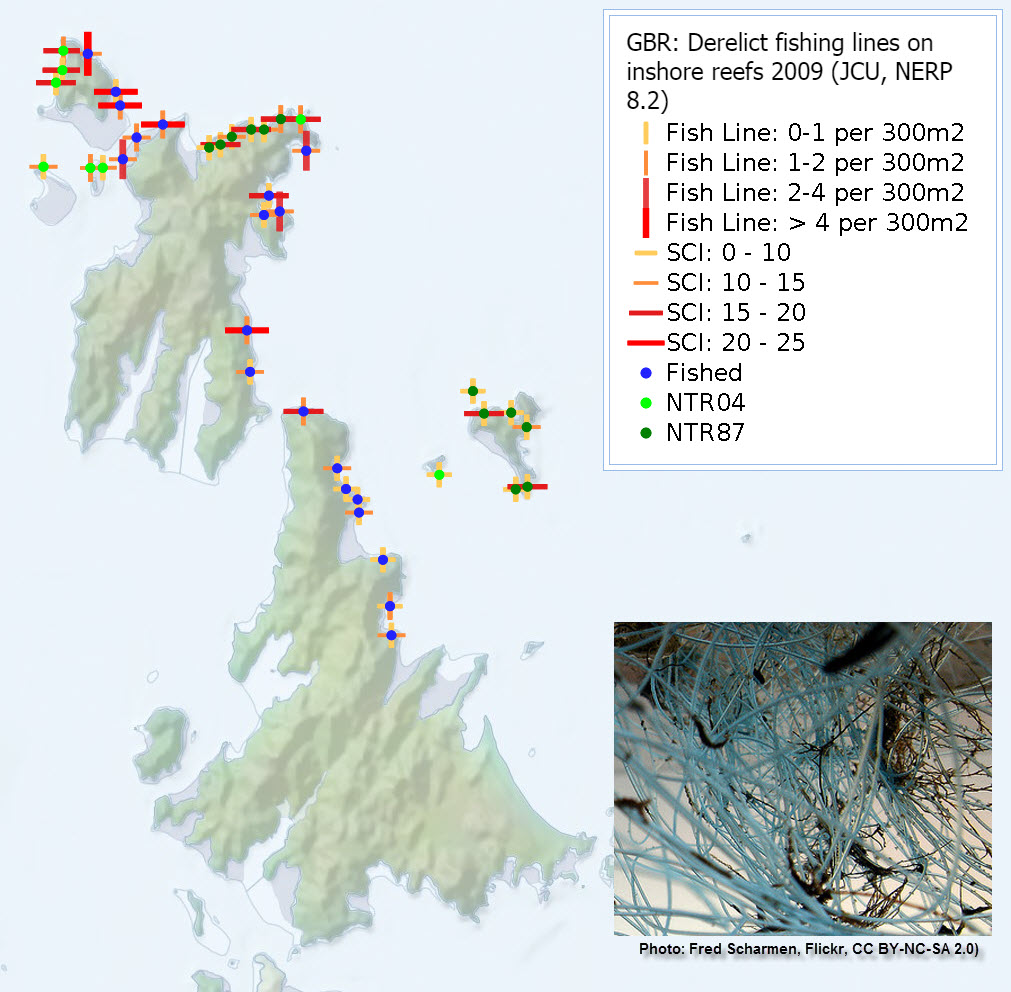
This dataset consists of site means of the density of derelict fishing line, the percent cover of major benthic categories on fringing coral reefs of the Keppel, Whitsunday and Palm Island groups, and the accumulation rate of fishing line at ten sites in the Palm Islands between 2007 and 2009. Monofilament nylon fishing line is persistent in the marine environment and once entangled in the reef, it can remain in place for many years. Temporal monitoring of the relative number of fishing lines recorded at each site can be used as a proxy for fishing effort. During the last few years we have established a collaboration with ReefCheck Australia to enhance this aspect of the project. In 2007, volunteer divers were tasked with removing all derelict fishing lines from a subset of the monitoring sites in the Palm Islands. In the last few years, the rate of line re-accumulation has been monitored to gauge relative levels of fishing effort and zoning compliance. Methods: Underwater visual census (UVC) was used to survey derelict fishing lines at 30 sites in the Palm Islands, 42 sites in the Whitsunday Islands and 22 sites in the Keppel Islands during 2009. Within each island group, half of the sites (n = 47) were located on reefs within NTMRs and half (n = 47) were on reefs that are open to fishing (non-NTMR). A proportion of the NTMR sites in each island group were located within ‘old’ reserves (NTMR 1987) protected since 1987; while others were located within ‘new’ reserves (NTMR 2004) protected since 2004. Five replicate 50 m x 6 m (300 m²) UVC transects were surveyed at each monitoring site by two observers using SCUBA. The total survey area at each site was 1500 m2. Transect tapes were deployed along reef slopes, parallel to the reef crest and at a depth between 4 m and 9 m depending on the reef slope topography at each site. The benthic community was surveyed using a standard line intercept survey method every 1 m along each transect (50 points per transect). Hard corals were classified as live or dead and assigned into morphological categories (branching, digitate, plate, massive, foliose, encrusting). Other categories of benthos included soft coral, sponges, clams (Tridacna spp.), other invertebrates (such as ascidians and anemones), macro-algae, coral reef pavement, rock, rubble and sand. Reef structural complexity was estimated using a five-point scale for both reef slope angle and rugosity. Five independent structural complexity estimates were made for each transect. Underwater visibility was recorded on each transect and ranged from 6 m to 12 m. Surveys did not proceed if the visibility was less than 5 m. Teams of volunteer divers from Reef Check Australia carried out the removal of derelict fishing lines at ten of the monitoring sites in the Palm Islands during April 2007. Five of the cleaned sites were located on reefs within NTMRs and five were on non-NTMR reefs. Four of the cleaned NTMR sites were located on the leeward side of Orpheus Island (NTMR 1987) and one site was at Curacoa Island (NTMR 2004). Of the cleaned non-NTMR sites, four were located on the leeward side of Pelorus Island and one was at Curacoa Island. The ten cleaned sites were randomly selected from a pool of eighteen sites that were in sheltered (leeward) locations and were identified as being readily accessible by fishers during calm to moderate (< 15 knots of wind) weather conditions. At each site, divers removed all sighted derelict fishing lines and tackle (hooks, sinkers, wire leaders etc.) on reef slopes between 4 m and 12 m depth, for 200 m in both directions from a central GPS waypoint marking the site position. Transect tapes were deployed to measure the distance covered and increase the search efficiency so that very few, if any, derelict fishing lines remained after cleanup operations were completed. Derelict lines that were overgrown with hard coral or encrusting sponges, or partially embedded in the reef matrix were cut, and all of the exposed (visible) sections of line were removed. All collected fishing lines were recorded on data sheets before being placed in catch bags and taken back to the boat for later disposal. Baseline UVC surveys of derelict fishing lines were conducted at each of the ten cleaned sites immediately prior to the removal of fishing lines in April 2007 and UVC surveys were subsequently repeated in December 2009, providing a 32 month period for fishing lines to re-accumulate on the reefs. The 2007 and 2009 UVC surveys on the 10 cleaned sites used the same methodology described in the survey methods section above. We assumed that all of the fishing lines recorded and collected were lost at the same location in which they were found. The authors recognize that the removal of derelict fishing line from ten of the thirty sites in the Palm Islands prior to the 2009 surveys would have reduced the fishing line density estimates for the Palm Islands. However the magnitude of this effect was balanced between old and new NTMRs and non-NTMRs, as only one-third of the monitoring sites in each zone were cleaned. Format: The data are contained within two worksheets of an Excel file (20 kB). All benthic data is in % cover. Fishing line data are presented as both mean density (mean number of lines per 300 m2) and a total summed value for each site (total number of lines recorded per 1500m2). The first worksheet provides the site-level data for 2009. The second worksheet provides the accumulation rates of fishing lines at 10 monitoring sites in the Palm Islands between their removal in 2007 and the re-survey in 2009. Data Dictionary: Names in brackets correspond to those used in the shapefile equivalents of the spreadsheet data. These names were adapted to work within the 10 character attribute limitation of shapefiles. - Fish Line_MEAN (FishLineMn) - mean number of lines recorded over 5 transects surveyed at each 300 m2 site. - Fish Line_SUM (FishLinSum) - is the pooled number of lines recorded on the 5 transects surveyed at each site. It is the total number of lines found over the 1500m2 surveyed at each site. - Line Accumulation Rate (LineAccRat) - number of lines accumulated per month. - SCI_MEAN - Structural complexity Index.. An index (1-25) calculated by multiplying our visual estimates of reef slope angle (1-5) by reef slope rugosity (Complexity 1-5). These values are estimated for each 10m section of each 50m transect. 5 transects per site = 25 SCI estimates per site. The data provided is site means… i.e. the mean of those 25 values. - %LHC_MEAN (LHC_MEAN) - Live hard coral cover (%), live hard coral only. References: Williamson D.H., Ceccarelli D.M., Evans R.D., Hill J.K., Russ G.R. (in press). Derelict fishing line provides a useful proxy for estimating levels of non-compliance with no-take marine reserves. PlosOne 2014